Whether you are working in a standalone or server project, NVivo provides tools that help you to collaborate and keep track of the work done by your team members.
In this topic
NVivo identifies team members based on their 'user profile'. In server projects, this profile is based on the user's Windows login while in standalone projects it is based on the name and initials that a user enters when they launch NVivo.
Refer to Create, view or change user profiles for more information.
You can assign a color to specific team members, this can help you visually track their work in a project. The colors you assign to users are reflected in coding stripes and charts.
Refer to About color for more information about using colors in your NVivo project.
When event logging is turned on, changes to your project are recorded in the project event log. You can view the event log to monitor who has made changes, when the changes were made and what project item was changed.
You can filter the log to see changes made by specific team members.
Refer to Keep a project event log for more information.
If multiple researchers are coding the same material, you may be interested in the consistency of their coding. NVivo provides a number of ways to check consistency or coder reliability:
Coding stripes—you can display coding stripes for users to see what individual team members have coded and the nodes they have coded at. If you assign colors to users, this is also reflected in the coding stripes.
Filtering in a node—when reviewing the references in a node you can filter the content to show only the references coded by specific users.
The Coding Comparison query—run this query to check for coding consistency among team members. Refer to Run a Coding Comparison query for more information.
Where coding consistency is important, it may be useful to agree on a node structure early and have regular discussions about how the structure is evolving.
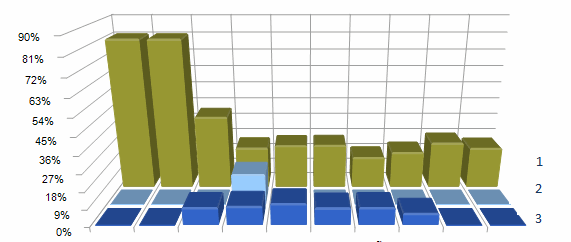
You can create a chart to visualize the work done by team members. For example, you could create a chart showing the percentage of coding at nodes done by users (1, 2 and 3) in a selected source:

If you assign colors to team members it is also reflected in charts.
For more information about working with charts refer to About charts.
You can run a predefined report to track the work of team members. For example,
You could also create your own report to track teamwork—for example, you could create a report listing each team member and the nodes they have created in the last week.
Refer to About Reports and extracts for more information.
You can also run queries to gather content based on the work done by specific users. For example, you could
Gather all the references to climate change that were coded by Mary and Tom.
Search for and analyze text in the sources that were created by Ben.
Compare the coding of two users or two groups of users by running a Coding Comparison query
Refer to About queries for more information.
When you are working with items in List View you can see who created or last modified the item. You can sort the List View by user name to see the work done by specific users—click on the column header for Created by or Modified by.