As your project grows you can use reports and extracts to
Review and revise your progress
Identify themes that are occurring more than others
Present your findings
Work with your data in other applications such as Excel or Word
In this topic
Reports contain summary information about your project that you can view and print. For example, you could check the progress of your coding by running a report that lists your sources and the nodes that code them.
An extract lets you export a collection of data to a text, Excel or XML file—you can use this data for complementary analysis in other applications.
NOTE Reports and extracts do not contain content from your sources or nodes. If you want to view source content based on selected criteria you can create a query.
NVivo provides a number of predefined reports and extracts that you can run at any time. You can also build your own reports and extracts and run them as your project progresses.
The Report Wizard and the Extract Wizard guide you through the process of
Choosing the 'view' of the data (for example—Node, Node Classification, Source, Source Classification and so on)
Choosing the fields
Defining filters (including filter options that you can select when you run the report)
Grouping the information and calculating summary values—refer to Summary and group options for more information.
Sorting the data
Defining the layout and presentation
If you want greater control over the content or appearance of your reports, you can design your own reports or refine existing reports using the Report Designer.
The Report Designer gives you the added ability to:
Add a header or footer with report information—for example, report title, date, or page number
Add images—for example logos or horizontal lines
You can also modify reports using the Report Designer. For example, you could initially build a report using the Report Wizard and then make changes to it using the Report Designer. You can also open one of NVivo's predefined reports and edit it in the Report Designer.
With Report Designer, you can:
Change the orientation of your report
Add or remove data fields
Change the order of your data
Change the colors in a report
Change the format—for example font, point size, or color—of the items in a report
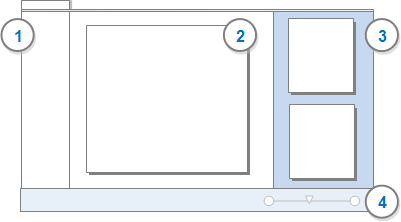
When you run a report the results are displayed in Detail View:

1 Displays the report map. If you are working with a grouped report, you can expand the heading to see the groupings and navigate to particular section of the report. You can hide the report map.
2 Displays the first page of the report. You can use the scroll bars to move through additional pages.
3 Displays thumbnails for each page, click on a thumbnail to display the page. You can hide the thumbnails.
4 Zoom in or out on report content.
You can print the report results, export the results to another format or export the criteria for use in other NVivo projects—refer to Manage reports and extracts for more information.
When you run an extract, the results are not displayed on screen. Instead, they are exported to the specified file type—text file (.txt), Excel file (.xls, .xlsx) or XML file (.xml). You can open the file in other applications that support the selected format.
You can export report results for use in other applications if you want to:
Send the results to someone who does not have NVivo.
Perform additional formatting or analysis. For example, you could export the report as a Word document, make formatting changes, and then include it as part of a larger document.
You can export report results to the following formats:
You can open and edit the results in any application that supports the selected formats.
You may create reports or extracts that are useful for other NVivo users. For example, you might build a report with quite complex criteria including grouping, filtering and summary calculations. To save time, you can share this 'template' with other members of your team.
You can export the report criteria (.nvr) or extract criteria (.nvx) in the NVivo Exchange Format and other members of your team can import it—of course, the report may yield different results when they run it over their own data.