In this topic
A dataset contains structured data arranged in records (rows) and fields (columns). For example, a dataset could contain survey responses. Each record (row) represents a single survey respondent. The fields (columns) contain demographic information about the respondent or their responses to the survey questions; as in the example below:
| Respondent | Age | Sex | Question 1 response | Question 2 response |
| Anna | 29 | Female | I think there should be more car-free zones. | Electric buses and taxis would help reduce pollution in the inner city. |
| Jack | 31 | Male | Pedestrians need to feel safe. There should be better lighting and more police. | We should create more green spaces. |
The data in a dataset source must be imported from a spreadsheet, database or text file—you cannot create or edit a dataset inside NVivo.
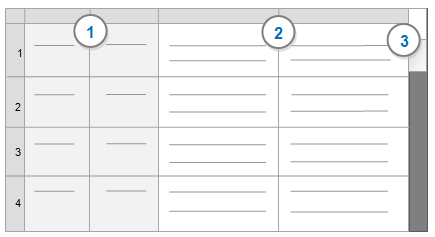
When you open a dataset, it opens in Table View (below)—the records and fields are displayed in a grid:

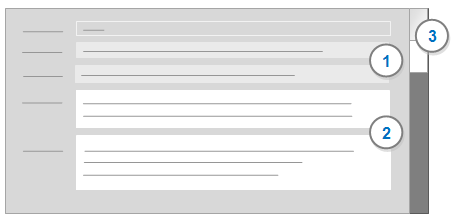
Form View (below) shows only one record at a time, laid out as a form:
:
1 Classifying fields—contain information about your data—for example, the age and sex of survey respondents. Classifying fields have a grey background. Refer to Learn about codable and classifying fields (columns) for more information.
2 Codable fields—contain the information you want to analyze—for example, responses to open-ended survey questions. Codable fields have a white background. Refer to Learn about codable and classifying fields (columns) for more information.
3 Table and Form View tabs—use these tabs to switch between Table View and Form View.
You can double-click a dataset in List View to open it in Detail View.
When the dataset is open in Detail View, you can switch between Table View (view all records) and Form View (view one record at a time).
Each row in a dataset has a unique record ID, based on the order in which it is imported. The ID is the first column In Table View, and the first field in Form View. If you sort the dataset by the values in the ID column, the dataset is displayed in the order that the records were imported into NVivo.
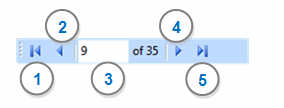
You can navigate from record to record on Table or Form View by using the navigation buttons—you can move to the first, previous, next or last record.

1 Move first
2 Move previous
3 Current position
4 Move next
5 Move last
When you click in the Current position box, you can type a record number and then press ENTER to navigate to that record. The record number is counted sequentially from the beginning of the records as currently visible in Table View. Hidden records are not counted—the Status bar indicates if any records are hidden (filtered) ![]() or if all records are visible (the dataset is unfiltered)
or if all records are visible (the dataset is unfiltered) ![]() . The record number does not correspond to the ID value or any other field value.
. The record number does not correspond to the ID value or any other field value.
You can also:
Use scroll bars to move up and down, or left and right
Use 'Go To' to quickly jump to a dataset record ID, see also link, or annotation If you try to jump to a record that is hidden, you will go to the next visible record.
When working in a dataset source you can:
Code or query the text in codable columns (you can also code source shortcuts)
Refer to Approaches to analyzing datasets for more information on various methods you can use to analyze a dataset source.
Before you import data to create a new dataset source, you should consider how you want use the data in NVivo.
You cannot change the data after you have imported it into NVivo, so before import, you should check that:
You have collected together all the data you need.
You have checked the quality and accuracy of the data.
You have considered the analysis type you will set for each field—classifying or codable. Refer to Learn about classifying and codable fields for more information.
You have considered what data type you will use for each classifying field—for example, text, date or decimal.
If your dataset contains survey responses, and you want to create a case node for each respondent, then the dataset must contain a unique identifier that identifies the responses of each individual. A unique identifier could be the respondent's name, however, in a large survey, names may not be unique. For uniqueness and to protect the identity of your respondents, you may prefer to assign each respondent a unique ID number. You can then gather all responses of an individual respondent to a single node—refer to Approaches to analyzing datasets for more information.
If you have a very large amount of data to import and analyze, it is a good idea to experiment with a subset of the data. If you import a small amount of data, you can experiment with the various approaches to analyzing a dataset. Once you are confident that you have imported the data in a way that supports your analysis, then you can import the entire dataset, and commence coding in earnest. Make sure you delete the sample dataset that you used for experimental purposes.
Refer to Import datasets for more information on preparing to import a dataset.
When you import data to create a new dataset, you can choose the 'analysis type' for each field (column)—you can select 'codable' or 'classifying'. Refer to Import datasets (Consider how you want to use your data in NVivo) for more information.
The following table compares codable and classifying fields:
| Comparison | Codable fields | Classifying fields |
| Type of content | Textual content that you want to analyze—for example, survey responses to open-ended questions such as What do you think is the most important environmental issue in your local area? | Values that describe the data—for example, in a set of survey responses, you may have classifying columns which contain the name, age or sex of the survey participants. Scaled responses—for example, your survey might include questions that are answered by choosing a point on a 'strength of agreement scale' containing points ranging from Strongly Disagree to Strongly Agree. |
|
Data types |
Text or source shortcut |
Text, integer, decimal, date, time, date/time, or boolean |
|
Background color |
White |
Grey |
| Edit content | No | No |
| Code content | Yes | No |
| Use values to build node hierarchies | No | Yes |
| Use values to populate node classification attribute values | No | Yes |
| Annotate & link | Yes | No |
| Query | Yes | No (see note below) |
| Sort & filter | No | Yes |
NOTE You cannot directly query the values of classifying fields, but you can use these values to create nodes or attribute values, and use the nodes or attribute values when you run queries, generate charts or other visualizations. Refer to Approaches to analyzing datasets for more information.
Databases can store 'binary objects', including images, documents, audio or video files. If you import a database table that includes 'binary objects', any image, document, audio or video files in supported formats (except plain text files) will be imported into NVivo.
Binary objects are imported into NVivo as separate source files, and stored in a folder at the same location as the dataset. The dataset displays an icon representing the source:
| Source type | Icon |
| Document | |
| Picture | |
| Audio | |
| Video |
The icon is a shortcut to the source—if you click the icon, the source opens in Detail View. If you code the source shortcut, the entire source is coded at the node.
If you move the source to a new project folder location, the source shortcut in the dataset is updated. If you delete the source, the source shortcut is deleted from the dataset.