When you work with data in rows and columns—for example, datasets, matrices, transcripts or the event log—you can use filters to see a subset of the information.
What do you want to do?
Filters can make information (such as datasets, transcripts and matrices) easier to work with. You can display only the rows that meet the criteria you specify and hide everything else. Working with a smaller set of data can make it easier to code, annotate or link. Filtering does not change your data in any way and you can easily clear a filter to see all of the data again.
You can only apply filters to columns or rows that display a filter icon ![]() . The filter icon changes to red
. The filter icon changes to red ![]() when the data has been filtered.
when the data has been filtered.
The Status bar also shows whether the information in the Detail View is filtered ![]() or unfiltered
or unfiltered ![]() .
.
NOTE
The information below describes column filters, but in matrices, you can also use row filters—refer to Filter, sort and customize node matrices.
In a dataset, you can only apply filters to the classifying columns (fields)—refer to Filter, sort and customize datasets for more information.
Select a column that displays the filter icon.
On the Layout tab, in the Sort & Filter group, click Filter and then click Filter Column.

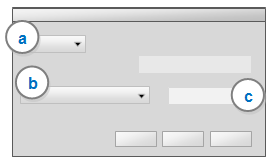
The dialog box opens.
Shortcut You can also click the filter icon ![]() to create a filter.
to create a filter.
Use the following steps to define the filter:

a Select Show or Hide—do you want to show or hide the rows that match the criteria?
b Select the type of filter—do you want to filter anything that 'equals' or 'contains' the specified text or is 'greater than' a specified value?
c Enter or select the criteria that you want to filter on.
Click OK to apply the filter.
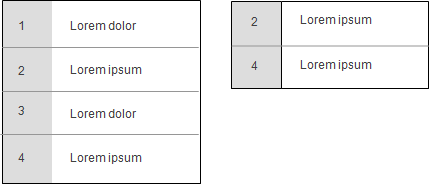
You can filter rows based on the text they contain—for example, show only rows that contain the text ipsum:

There are various other types of text filters that you can create, for example:
Hide the rows that contain the text ipsum.
Show rows that contain any of the text dolor, ipsum.
Show rows that exactly match (equal) the text string lorem ipsum.
You can filter rows based on the numbers they contain—for example:
Show the rows with values greater than 42.
Hide the rows with values less than 300.
Show the rows with values greater than or equal to 200 and less than or equal to 500.
You can filter rows based on the dates and times they contain—for example:
Show the rows with date less than 04/03/2009.
Hide the rows with date less than 04/03/2009.
Show the rows with date and time greater than 04/03/2009 12:00 AM.
You can filter rows by showing or hiding rows that contain empty cells. For example, you could filter a transcript to see only the timespans that have recorded content.
When working in the project event log, you can filter the events based on the type of event. For example you could
Show all events where a project item was created
Show all events where a project item was deleted
Hide all events where a project item was modified
More than one column in the project event log can have a filter—for example, you could show only modifications to the project after 05/07/2010.
You can apply filters on more than one column. As each additional column is filtered, the number of rows is further reduced.
NOTE Multiple filters cannot be applied to matrices.
Select the column that contains the filter you want to clear.
On the Layout tab, in the Sort & Filter group, click Filter and then click Clear Filter on Column.

The selected filter is cleared.
Shortcut Click filter icon ![]() , then select the Clear Filter button on the dialog box.
, then select the Clear Filter button on the dialog box.
NOTE To clear all filters, click Filter in the Sort & Filter group on the Layout tab, and then click Clear All Column Filters.
Select the column that contains the filter you want to change.
On the Layout tab, in the Sort & Filter group, click Filter and then click Filter Column.

The dialog box opens.
Make the changes to the filter.
Click OK.
Shortcut Click the filter icon ![]() and make the changes to the filter.
and make the changes to the filter.