In this topic
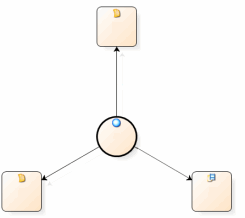
You can generate a graph to show how project items are connected to a selected source or node.

You can choose to show more or fewer associated items on a graph—for example, if you have graphed a node, you may want to see only the sources coded at the node or only the parent or child nodes.
Graphs are not retained in your project when you close NVivo. However, you can convert a graph to a dynamic model that is stored in your project. You can then make changes to the model—for example, add comments, change the layout, resize the shapes, or change the fill color.
You can use graphs to see:
Connections between a selected source, or node and other project items.
Nodes that have coded a particular source—for example, what nodes have coded 'Competing water uses'?
Parent or child nodes for a selected node in a graphical display.